Tracking data and building dashboards for digital reporting has just become easier.
We understand how important it is to make sense of the digital data that is streaming into your business.
Connect your data from any tool and track it from any device. No more logging into dozens of different tools to understand performance — now you and your team can easily connect your data, build and share reports, monitor trends, and discover insights.
Easily track thousands of metrics from all of your tools
Do you need digital marketing data, packed with the most popular metrics and their common visualizations already built in?

You can spend less time figuring out how to visualize your data and more time actually acting on it.
Data on spreadsheets are so un-attractive and boring! And we all know integrating data into beautiful dashboards are great, but not always an easy task. But now with this amazing software it can easily be done.
You can spend less time figuring out how to present your data and more time actually interpreting it. Mix and match metrics from different sources in one dashboard and get a more complete view of your performance at a glance.
More than dashboards
A lot of magic happens when you connect all of your performance data in one place—you can also set and measure progress toward goals, create custom metrics, share and automate reports with your team, get notifications when certain metrics are on or off track, and much more.
Features include:
- Share important metrics from across your organisation
- Set goals and visualize your progress towards them in real time
- Get daily, weekly, or monthly performance updates through email and more
- Get automatic alerts when important metrics and trends go up, down or are right on-track
- Connect multiple dashboards together to create one comprehensive report
- Calculate metrics, conversion rates, and ROI from multiple sources
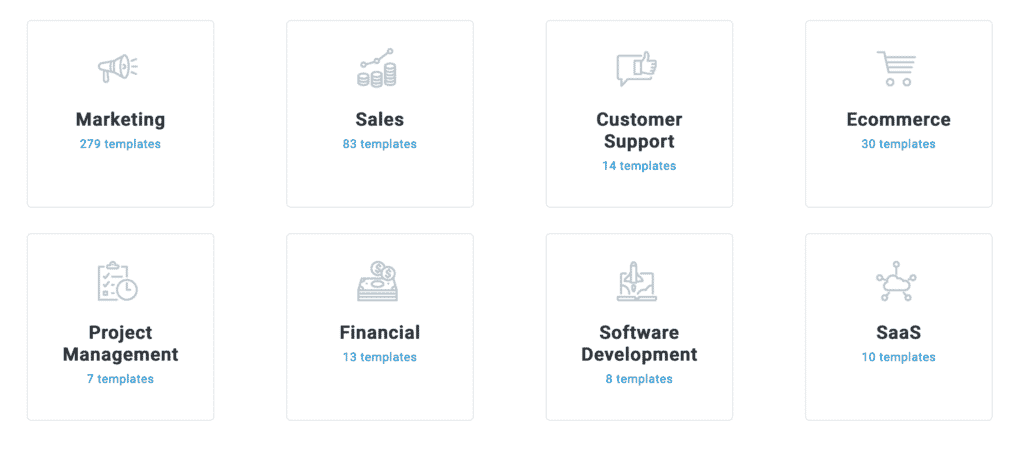
Start from a template and visualize your performance in minutes
Just connect the appropriate data source(s) and your data will automatically populate. Templates can also be customized.
SEO Dashboard Examples and Templates
Track your SEO performance from tools like Ahrefs, SEMrush, Moz, Google Search Console, and Accuranker from our library of pre-built templates. Just download any template for free, connect your data, and get instant visualizations of things like top keywords by position, average position by page, backlinks, referring domains, site errors, and much more.
PPC Dashboard Examples and Templates
Track your PPC performance from tools like Google Ads, Facebook Ads, Bing Ads and AdSense from our library of pre-built templates. Just download any template for free, connect your data, and get instant visualizations of things like ad impressions, CTR, CPC, and much more.
Social Media Dashboard Examples and Templates
Track your social media performance from tools like Facebook Pages, Instagram Business, LinkedIn Company Pages, and Twitter from our library of pre-built templates. Just download any template for free, connect your data, and get instant visualizations of things like impressions, reach, number of followers, and much more.
Content Marketing Dashboard Examples and Templates
Track your content marketing performance from tools like Google Analytics, Google Search Console, and HubSpot Marketing from our library of pre-built templates. Just download any template for free, connect your data, and get instant visualizations of things like sessions, pageviews, bounce rate, and much more.
Marketing Automation Dashboard Examples and Templates
Track your marketing automation performance from tools like HubSpot Marketing, HubSpot CRM, Pardot, Active Campaign, and Klaviyo from our library of pre-built templates. Just download any template for free, connect your data, and get instant visualizations of things like leads, MQLs, conversion rate, and much more.

Financial Dashboard Examples and Templates
Track your financial performance from tools like QuickBooks, Stripe, and Xero from our library of pre-built templates. Just download any template for free, connect your data, and get instant visualizations of things like income and expenses, cash flow, net profit margin, gross profit margin, and more.

Dashboard Features for Businesses
Business owners valued these options the most:
- Displaying information clearly and efficiently
- Communicating information quickly
- Processing data in real-time
- Showing trends and changes in data over time
- Presenting the most important data in a limited space
9 unique features most business prefer in a data tool:
- Customizable dashboards
- Real time data
- Ease of use
- Flexible sharing
- Ability to expert data
- Drill downs
- Integration
- Progress checking
- Device compatibility
The most frequently named interactive dashboard feature among our respondents was customization. With a customizable dashboard, you can choose what data points and visualizations you can see. Also, a customizable dashboard offers every user their choice of visuals, from a graphical dashboard for those who prefer charts to a numerical one for those who prefer hardcore numbers. As you add and remove data from your dashboards, you want your visuals and metrics to reflect those changes ASAP. It also helps when your dashboard data updates at the same time as your data sources. Real-time data processing solves both of these problems.
A dashboard tool is only good if it’s easy enough for everyone on your team to use.
With DataBox you will make sense of the digital data that is streaming into your business, effectively and better than before.
Databox has all the traits of an ideal dashboard tool. Features like customization, flexible sharing, and integration variety make it easy to pick up and scale with your organization.
Visit the DataBox website for more information or contact us directly.
Connect your data from any tool and track it from any device. No more logging into dozens of different tools to understand performance — now you and your team can easily connect your data, build and share reports, monitor trends, and discover insights.


